Exporting Client Reports
What this is for, in one sentence: Report Export turns a client’s data into the branded, six-page “AI Visibility Audit Report” PDF you hand to clients and leadership.
When to come here:
- Monthly reporting, pitch follow-ups, QBRs — any moment the work has to become a document
- Right after a strong period, while the numbers make your case
- Before a renewal conversation: the Game Plan page is your “what’s next” in writing
For Marcus Tan, the export is the highest-stakes surface in the product: nothing else he does in Zicy is seen by a client, but this PDF carries NorthStar’s logo into a boardroom. Every upstream number ends up here, and the report you send is the report your agency is judged on.
Customising the report
Section titled “Customising the report”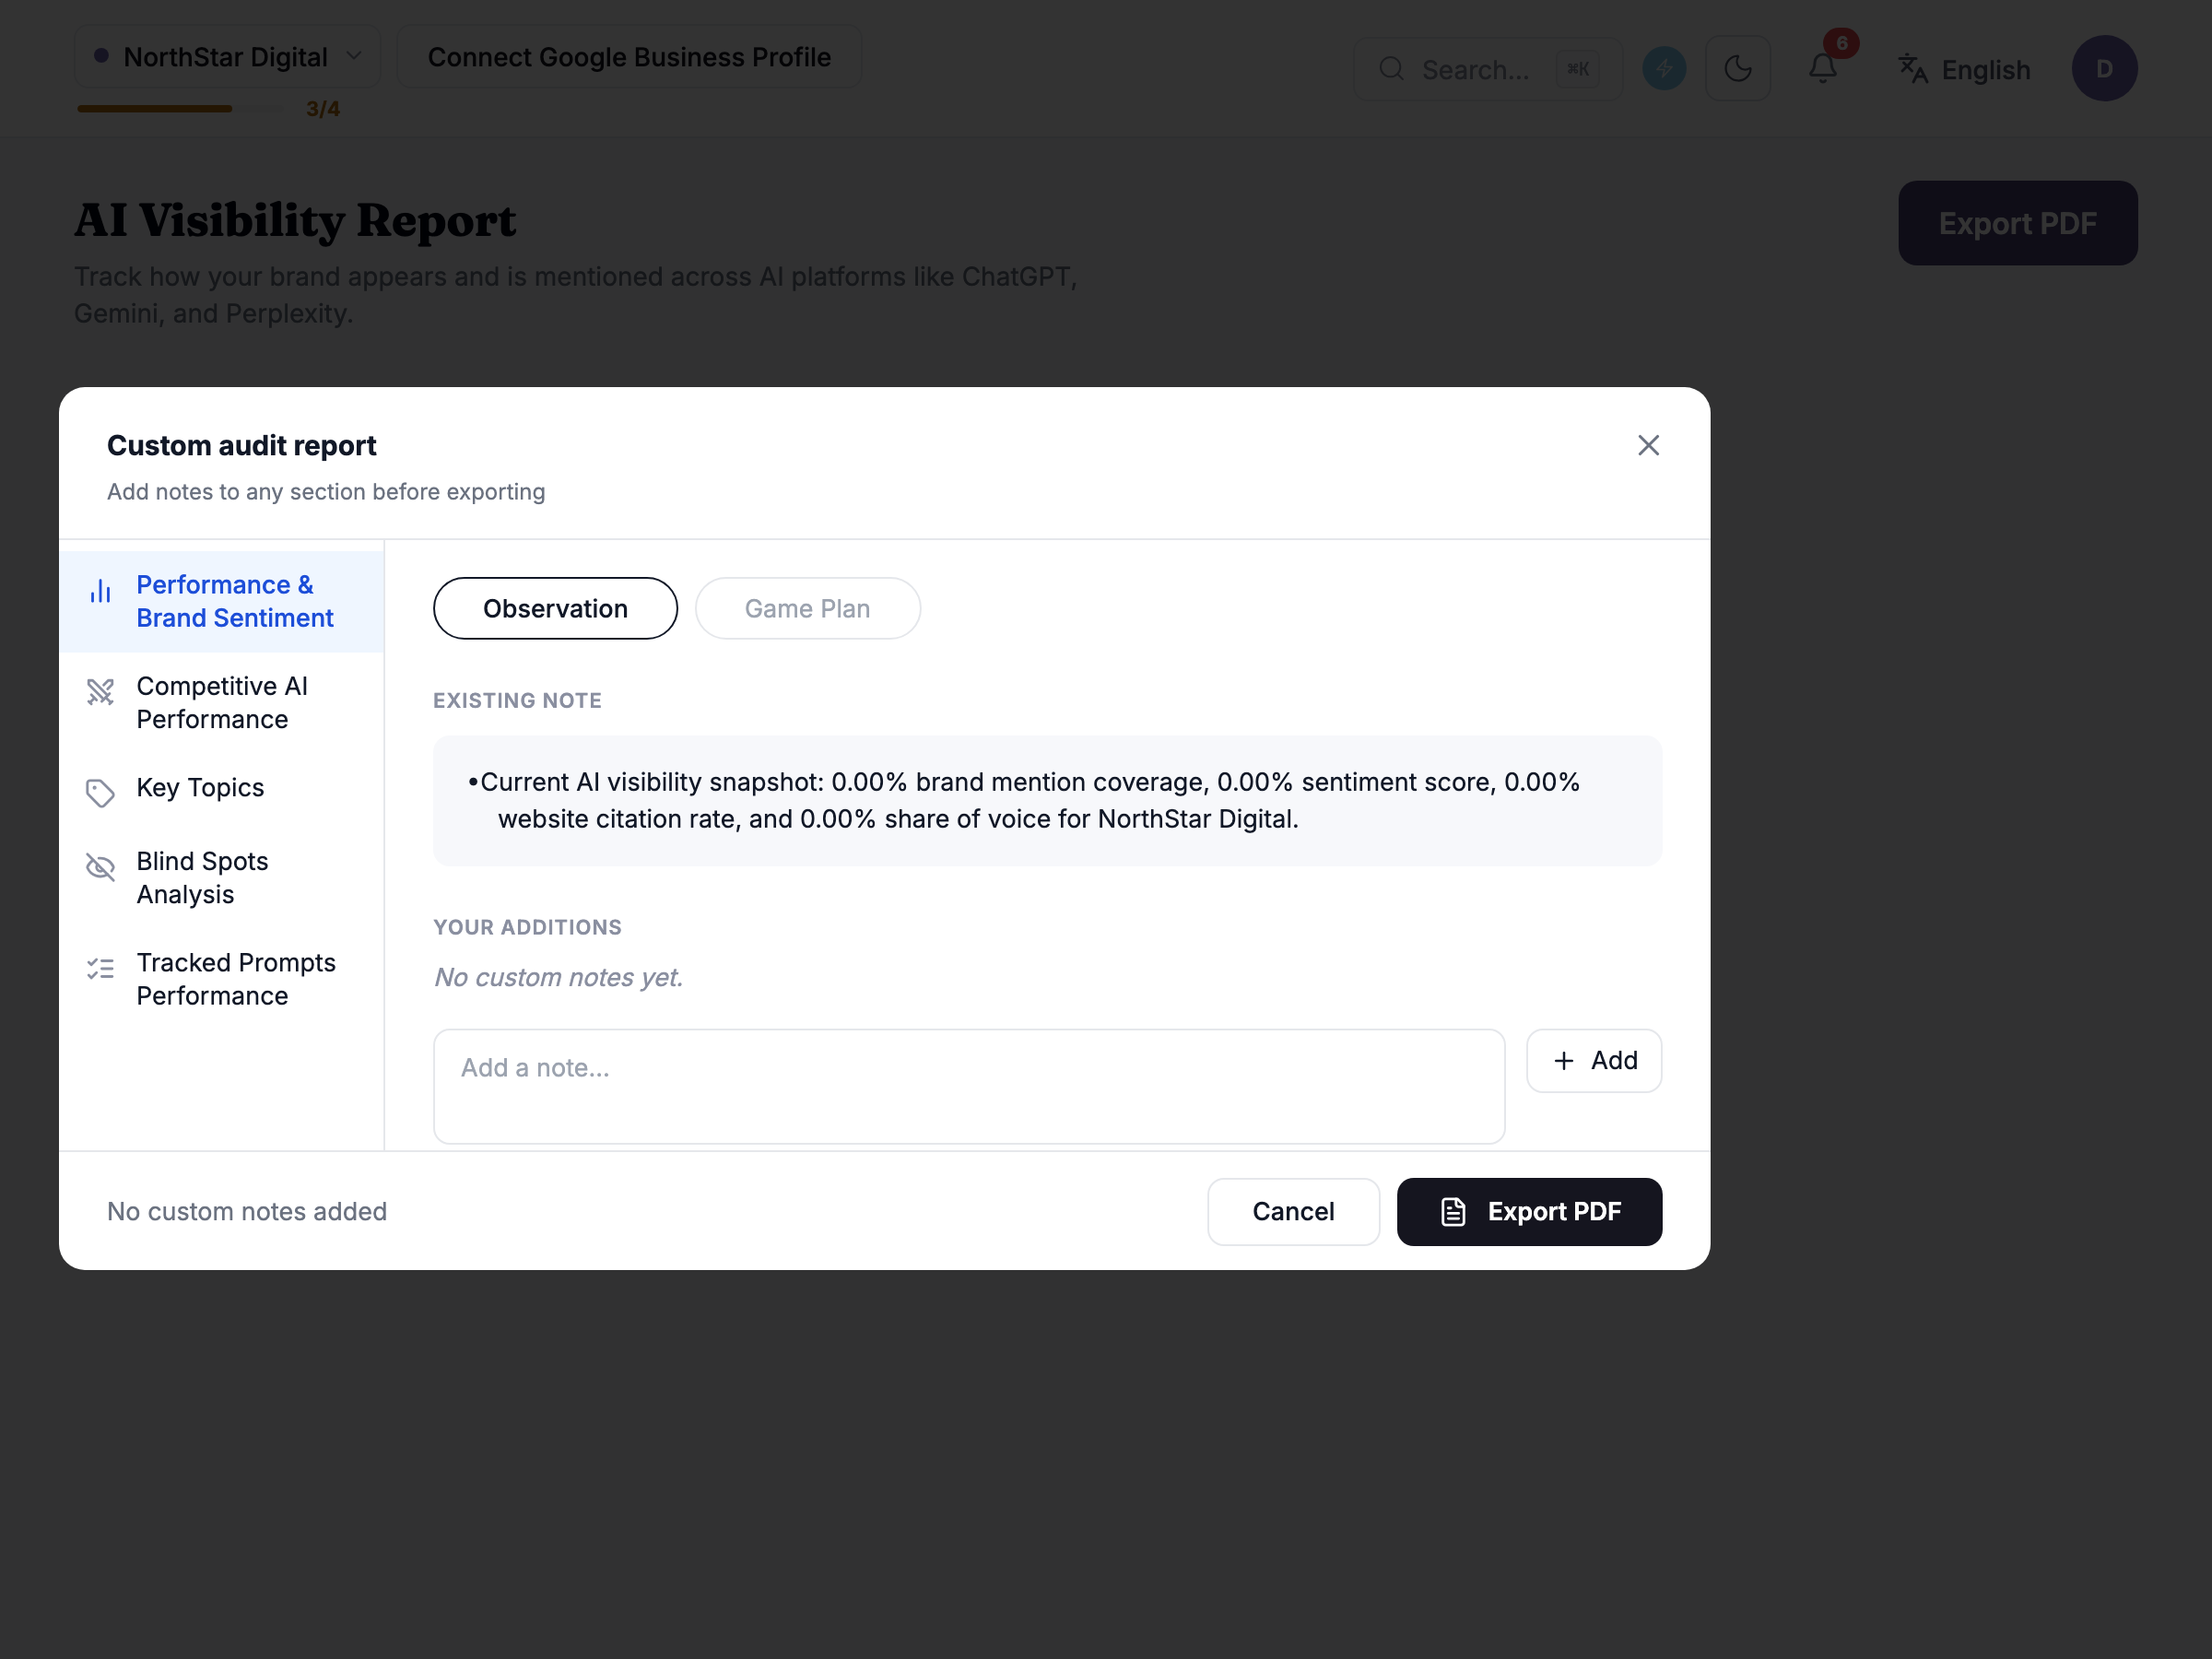
The report follows a six-page arc, and the modal lets you shape it per client through the underrated feature: add a custom note to any section. The section titles are written for the person who’ll actually read them (“How visible your brand is in AI answers”, not an acronym), and the arc runs measurement → comparison → perception → topics → citations → Game Plan.
Use the custom notes deliberately, because they’re where the agency earns its margin. The numbers are generated; the meaning is yours. A note like “Priorities agreed in the July call: schema and llms.txt first, pricing-page work in August” turns a data page into an account narrative — decisions, sequencing, the reasoning a dashboard can’t carry. The clean division: the product owns the numbers; you own the story. Notes are for interpretation and commitments, never for restating (or arguing with) the data beside them.
Branding isn’t something you pick at export time: when you confirm, the export fetches your organisation’s white-label logo and prints it in the report header. There is one logo on the report, not two. Configured once in Settings (see Team, Settings & White Label).
Custom data export
Section titled “Custom data export”The export modal has two tabs: Custom Audit Report, which is the PDF described above, and Custom Data Export, which gives you the numbers as a spreadsheet instead of a document.
On the data tab you tick the datasets you want: Prompt Performance (one row per prompt, with every engine’s mentions, citations, position and share of voice), Key Topics (every topic across Brand Leaders, Battlegrounds and Blind Spots, with your share and the top three competitors on each) and Competitors (your brand and every competitor, with coverage, share of voice, average position and sentiment).
The tab shows the date range the export covers, and either the tags applied, when you have filtered the dashboard by tag, or “All prompts” when you haven’t. The spreadsheet follows that scope.
Select at least one dataset, then click Download spreadsheet. All the datasets you picked arrive together in one Excel (.xlsx) file, with one sheet per dataset.
If one dataset can’t be built, Zicy tells you how many were exported and that the failed one is not in the file, so check the message before you send it on.
What the client receives
Section titled “What the client receives”Page one opens with the report header, printed once at the top rather than repeated on later pages: the title, your white-label logo where one is configured (the bundled Zicy logo otherwise), “Brand: {name}” for the audited brand, and the data period the screenshots reflect.
Next comes a screenshot that captures more than the four metric cards on their own: it includes the on-screen Mention Coverage, Web Citation Rate, Share of Voice, and Avg Ranking cards, plus the platform coverage panel and the performance trends chart underneath them. Below the screenshot, a glossary defines each metric in its own two-sentence entry, under different report-only names, Brand Mentions Coverage, Website Citations Coverage, Share of Voice Performance, and Average Ranking, rather than the on-screen labels, plus one summary line on overall AI visibility performance. There’s no narrative yet, just the screenshot and the glossary. Leave the glossary in: the exec who receives this report forwards it to someone who wasn’t in the room, and that second reader needs it.
The generated Observation and Game Plan narrative isn’t part of the KPI section. It’s built from the same coverage, share-of-voice, and ranking figures, and prints together with the Brand Sentiment section.
The report reflects the period you selected, not the work you did yesterday. Fixes shipped late in a period may not be visible in AI answers yet, since there’s a lag between publishing a change and AI systems picking it up. If you shipped major work this week, say so in a section note rather than expecting this period’s numbers to already show it.
Common questions
Section titled “Common questions”Can I edit a number before exporting? No.
The figures come from the same data the dashboard shows: the export’s headline share of voice, for instance, is read from the same KPI summary as the on-screen card, not recalculated separately.
What you control is the narrative: the modal lists five sections, each offering a small set of labels that always includes Observation, and the bullets you add go under the label you pick, alongside any generated bullets already sitting there.
Will the client see any Zicy branding?
Usually only if you haven’t set up a white-label logo: the header carries a single logo, your organisation’s white-label logo when one is configured in Team, Settings & White Label and loads, and the standard Zicy logo otherwise.
Six pages feels long or short for my client, can I change it?
No. Every export builds the same six sections in the same order, and nothing in the modal changes which sections the report carries or their order. What you can change is the notes inside each section.
What to read next
Section titled “What to read next”- Team, Settings & White Label — where the branding this report renders under is configured, once.
- Competitive — the source of the comparison table behind page 2, and the place to fix a competitor set before it reaches a client document.
- AI Visibility Dashboard: its Brand Sentiment panel is the source behind “What AI says about your brand”.