Key Topics Analysis
What this is for, in one sentence: Key Topics maps every subject AI platforms associate with your space: it shows where AI already features you, where you’re contesting rivals, and where audience demand exists but you’re invisible, so you know exactly what to publish next.
When to come here:
- When planning your content calendar or commissioning stories: this is a demand map written by your actual audience’s AI questions
- When a rival seems to be “everywhere” in AI answers and you want to know on which subjects, specifically
- After publishing into a gap, to check whether AI has started featuring you on that topic
Nadia Rahman runs content at GreenGrid Media, a solar and renewable-energy publication. Her readers increasingly ask AI their questions before they ever reach a publisher, and if AI doesn’t recognise GreenGrid’s coverage on a topic, that audience never arrives. This screen is her commissioning map: what people ask, who AI features, and where the open ground is.
The topic landscape
Section titled “The topic landscape”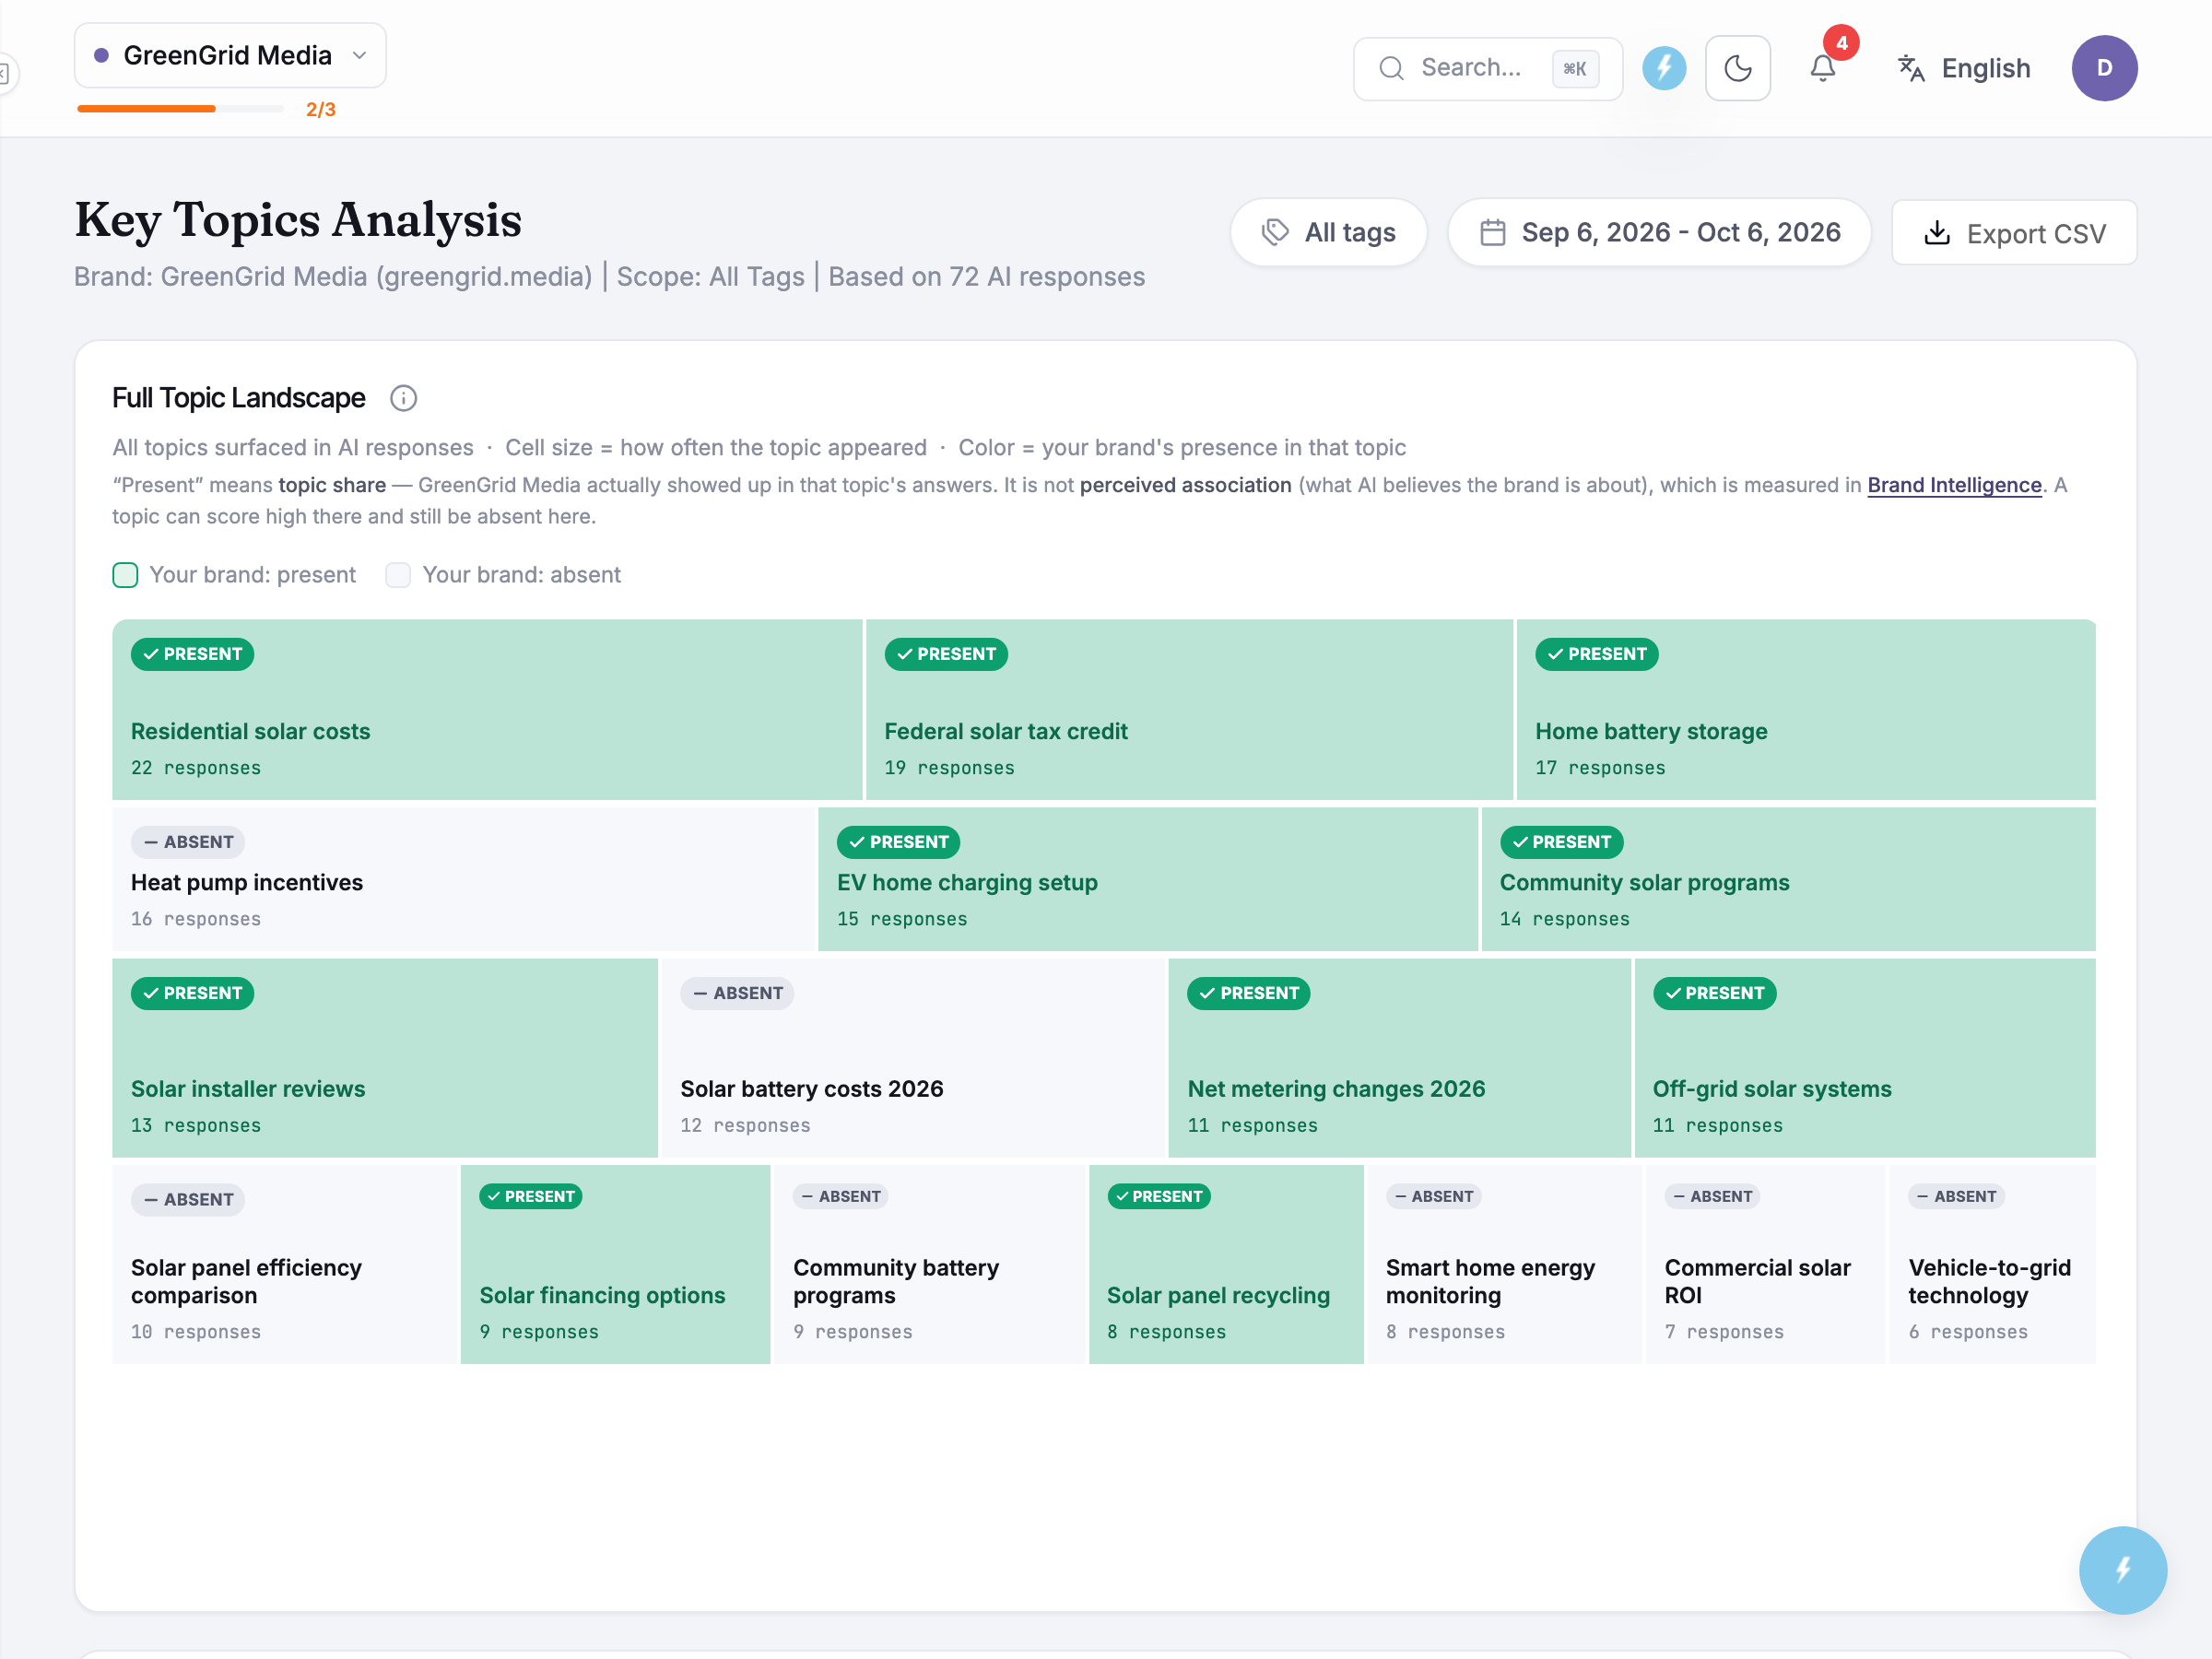 The page opens on the subtitle stating whose data you’re looking at (“Brand: GreenGrid Media (greengrid.media) | Scope: All Tags | Based on 72 AI responses”), with All tags and a date range as controls alongside Export CSV. Below that, the Full Topic Landscape panel shows your category’s highest-demand topics: the endpoint caps each tier at its top ten here, so the grid is a highlights view, not every topic you have data on. Each tile is coloured by whether your brand appears when the topic comes up, and sized by its share of demand within its row. Present cells carry a green wash and a present badge; absent cells stay grey. Hovering a tile shows the exact split (your brand’s mentions over the topic’s total), the percentage, and, where topics were merged, which ones.
GreenGrid has 48 topics in total across 72 analysed responses (the page-wide count, not the number of tiles drawn above), split into 6 Leaders, 9 Battlegrounds, and 33 Blind Spots on the tabs below. The single biggest cell, residential solar costs, touched by 22 responses, is only 41% GreenGrid’s. The Brand Leaders tab shows where the brand genuinely owns the conversation: community solar programs (64% presence across 14 responses), Net metering changes 2026 (55%), solar panel recycling (50%).
Each tier tab carries a plain-language explainer under the tab row rather than a tooltip you have to hunt for: Leaders are topics where AI already associates your brand, Battlegrounds are ones you’re present in but not leading, and Blind Spots are in-demand topics where you’re barely part of the conversation.
The panel also explains what “present” means before you read too much into it: it’s topic share, meaning GreenGrid actually showed up in that topic’s answers, not perceived association (what AI believes the brand is about generally), which is measured in Brand Intelligence. A topic can score well there and still be absent here.
Honest guidance: demand counts overlap. One AI response usually touches several topics, so demand numbers don’t sum to your response count and shouldn’t be added together. Use demand to rank topics against each other, not as an audience-size estimate.
Battlegrounds: where the fight is live
Section titled “Battlegrounds: where the fight is live”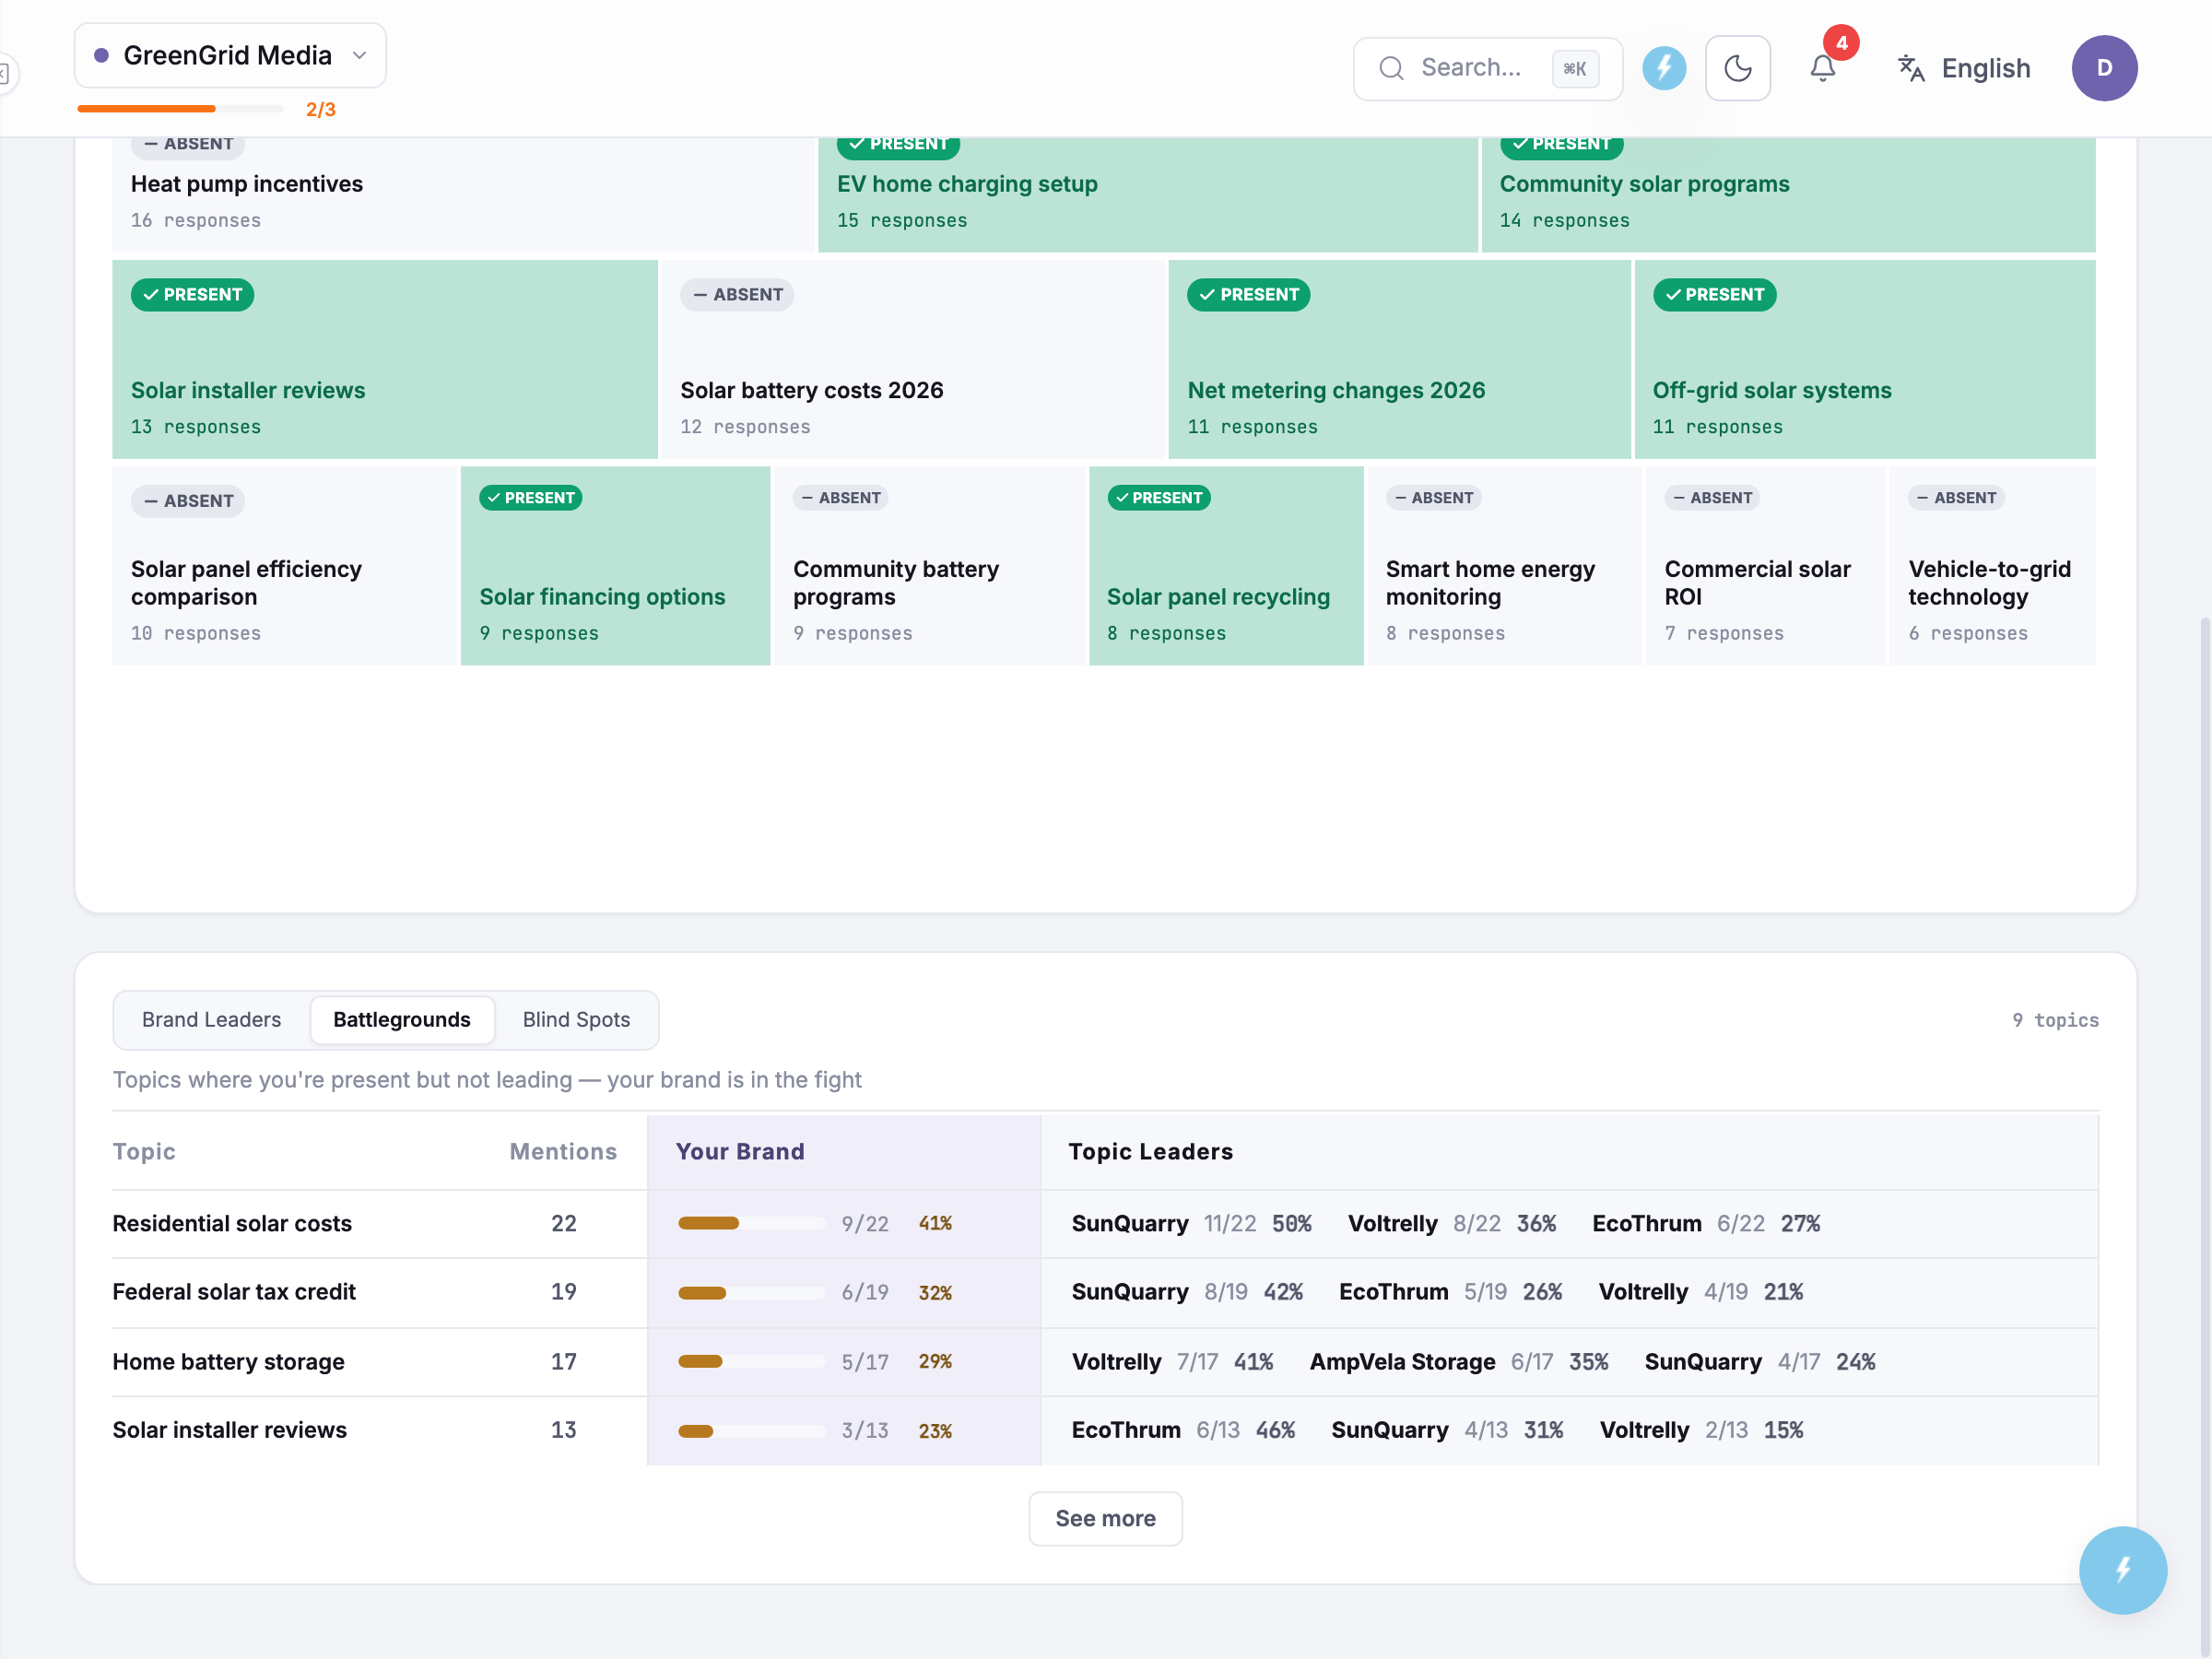 Battlegrounds is the highest-leverage tier for an established publisher, because the entry cost is low (AI already associates you with the topic) and the prize is a leader’s share of the category’s biggest subjects.
Among GreenGrid’s nine battlegrounds, the largest tell one story: SunReport leads the two biggest topics in the entire landscape (residential solar costs, 22 responses, GreenGrid at 41%; federal solar tax credit, 19 responses, GreenGrid at 32%). VoltDaily leads home battery storage (17 responses, GreenGrid at 29%), and EcoWire leads solar installer reviews (13 responses, GreenGrid at 23%). These aren’t gaps to enter; they’re beats to win, and the presence percentage tells you how far from the front you’re starting.
A practical reading order: sort by demand, then ask of each row, “do we have a definitive piece on this, and is it the kind of content AI cites?” A battleground where you’re at 41% with dated coverage is usually a refresh-and-restructure job, not a new commission (see Site Audit and Take Action → Content Optimizer for the how).
Blind Spots: the commissioning map
Section titled “Blind Spots: the commissioning map”The Blind Spots tab flags the ten highest-demand blind spots first, with a divider marking where that shortlist ends; the remaining topics load ten at a time behind a See more button. For an editorial team, the shortlist is a ready-made pitch meeting: topic, proven demand, and who currently owns the answer.
GreenGrid’s top gap is heat pump incentives (16 responses, 0% presence), followed by EV home charging setup (15 responses, 7%), Solar battery costs 2026 (12 responses, 0%) and off-grid solar systems (11 responses, 9%) among the 33 blind spots in total. Topic leaders here are simply whichever brand or name AI mentions most for that subject: sometimes a direct rival, sometimes not, and the list doesn’t sort or label them by type.
Unattributable topics are flagged honestly. Where a topic has real demand but no leader can be attributed, the row says so plainly rather than showing a blank leader cell: the mentions are too generic to credit to anyone, and nobody owns it yet. For an ambitious editor, an unclaimed topic with real demand is the best kind of blind spot.
The Export CSV button turns every tier, including the full Blind Spots list beyond the shortlist, into a workbook with mentions and your-brand-percentage columns intact, ready for your editorial calendar or a commissioning meeting. On a very long list it caps at the top 1,000 topics per tier and tells you it did so, rather than silently truncating the file.
Honest guidance: presence lags publishing. Shipping a definitive piece into a blind spot usually won’t move its presence number for a few weeks; AI platforms re-crawl and re-weight on their own schedules. Commission from this map monthly, and use the dashboard’s daily, weekly, or monthly trend views to judge results across periods rather than days. Before attributing a presence jump to your new piece, check whether your prompt set changed in the same window: the composition-change trap applies here too.
Honest guidance: don’t chase every cell. Thirty-three blind spots is not thirty-three assignments. The shortlist is demand-ranked, but your filter should be editorial fit: a topic led by a name you don’t recognise as a rival, adjacent to your beat, may be a better commission than a higher-demand topic outside your authority.
Common questions
Section titled “Common questions”How does a topic end up in Leaders vs Battlegrounds vs Blind Spots?
By who leads it and how present you are: topics you lead sit in Leaders, topics where you appear but someone else leads are Battlegrounds, and topics with demand where you’re barely or never present are Blind Spots.
Presence is calculated per topic: the share of that topic’s responses in which your brand appears.
Two similar topics used to appear separately. Where did one go?
Near-duplicate topics are merged in the dashboard before the topics are drawn (for example, “30% federal tax credit” is folded into “federal solar tax credit”), so demand concentrates instead of splitting across variants. A merged tile or table row notes what was folded into it, so the consolidation is visible rather than something that just quietly happened.
A brand I don’t compete with is listed as a topic leader. Why? Topic leaders are whoever AI mentions most on that subject: sometimes a manufacturer or an unrelated brand rather than a rival publication, and the list doesn’t filter or label them by type. That’s information, not an error: it tells you what kind of content currently owns the answer, and it’s worth checking against your own knowledge of the market before you treat it as competition.
Does high demand here mean high search volume? Related but not identical: demand counts how often the topic surfaced across your tracked AI responses, which reflects what people ask AI in your category. It’s the right ranking signal for AI visibility work; pair it with your usual keyword data for total-audience sizing.
We published into a gap. How do I verify AI noticed? Watch the topic’s presence across the next periods (daily, weekly, or monthly on the dashboard’s trend views) and check Citation Analysis to see whether AI has started citing the piece itself. If presence moves but citations don’t, AI is absorbing your angle without crediting you, which is a different problem worth knowing about.
What to do next
Section titled “What to do next”- Citation Analysis: whether AI actually cites your pages when your topics come up; the recognition layer beneath this map.
- Brand Intelligence: how AI describes your brand and what it gets wrong; Key Topics and Brand Intelligence link to each other, since what AI associates with you shapes which topics you lead.
- Site Audit: if AI can’t read your site properly, no amount of commissioning fixes a blind spot.
- Take Action → Content Generator: draft the definitive piece for a shortlist topic, with sources, ready for editorial review.
- Comparing Yourself to Competitors: the brand-level view of the rivals who keep appearing as topic leaders here.