How to Read Daily, Weekly and Monthly AI Visibility Trends
Learn how to stop reacting to one day's number and start reading your AI visibility data correctly so you can see whether your business is actually improving over time.
Key Takeaways
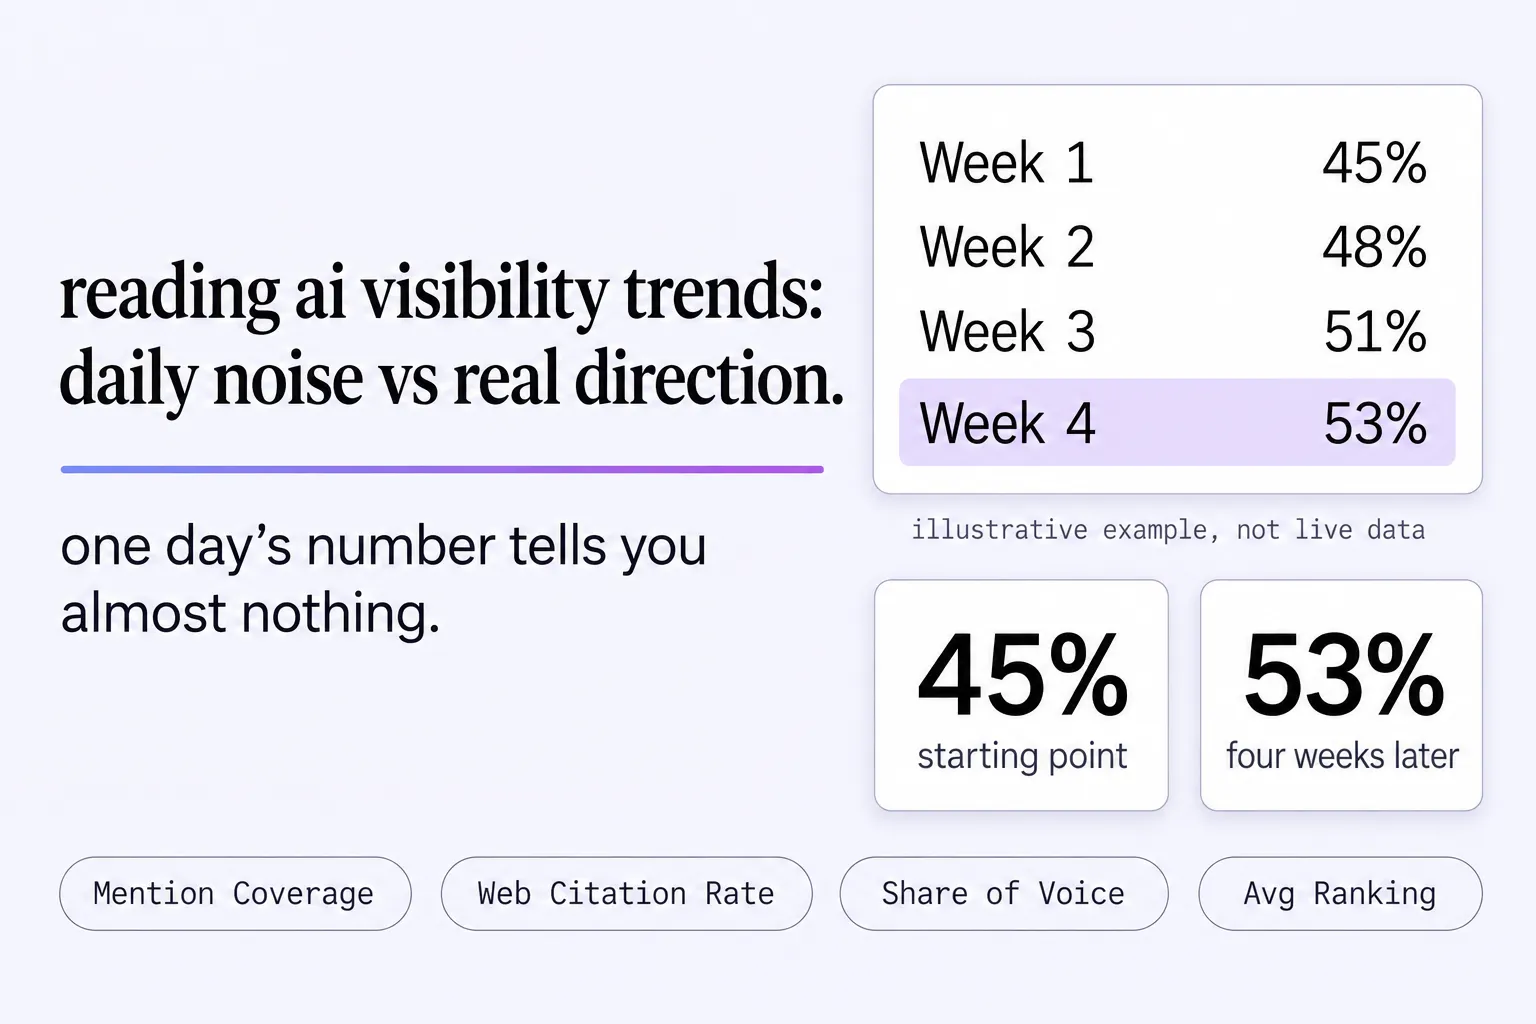
- One day's number tells you almost nothing. What matters is whether your business shows up more in AI answers over weeks and months.
- AI answers change from day to day. A drop today does not always mean something went wrong.
- Use daily numbers to spot unusual changes, weekly numbers to see direction and monthly numbers to measure real progress.
- Compare this week with last week and this month with last month, rather than today with yesterday.
- When a number changes, find the specific question that caused it and read what the AI said.
- Small, steady improvement over three months means more than one good day followed by a drop.
Introduction
Imagine you own a small bakery in Subang Jaya. One Tuesday morning, your sales are double what they normally are.
You feel great, but you would not call your landlord and ask for a bigger space yet. Maybe it was the school holidays. Maybe someone shared your post. Maybe it was just a good day. You would wait before making a big decision.
Reading your AI visibility numbers works the same way.
AI visibility means how often your business appears when someone asks an AI app a question related to your type of business. When someone asks ChatGPT “Which bakeries in Subang Jaya are good for custom cakes?”, does your bakery get mentioned?
Business owners often check the number every day and react to every small change. This guide explains what daily, weekly and monthly numbers mean and how to use all three together.
What Is Being Measured?
When you track AI visibility, four things are measured:
- Mention Coverage: Out of all tracked questions, how often does your business get named? If it appears in 6 of 10 answers, Mention Coverage is 60%.
- Web Citation Rate: How often does AI also include a link to your website? Being named is one thing. Having AI point people to your site is another.
- Share of Voice: Compared with competitors, how much space does your business get in the AI conversation?
- Average AI Ranking: When your business is listed with others, where does it tend to appear? A lower number means your business appears earlier.
These four numbers are checked automatically every day across ChatGPT, Gemini, Perplexity, Google AI Overviews and Google AI Mode. Daily updates do not make each day's number a final verdict.
Why Your Numbers Go Up and Down Every Day
AI apps do not keep a fixed list of businesses to recommend. Each time someone asks a question, the AI generates a fresh answer. The same question can get slightly different answers on different days.
Think of asking a friend for a recommendation on Monday. They suggest three places. Ask again on Friday and they might mention a fourth they just heard about. AI behaves in a similar way: generally consistent, but not perfectly identical every day.
It is also why one platform can show different results from another. Your business might appear in ChatGPT but not Gemini for the same question on the same day.
How to Read Daily Numbers
Daily numbers are useful for one thing: spotting something very unusual.
If Mention Coverage drops sharply overnight and stays low the next day, that is worth investigating. A source that used to mention your business may no longer be available, or a competitor may be receiving new attention.
If the number moves slightly up one day and slightly down the next, that is normal. There is nothing to fix.
Daily rule: Look for large, sudden changes that last more than one day. Ignore small movements up and down.
Do not change your business or website based on a single bad day. Wait to see whether the change sticks.
How to Read Weekly Numbers
Weekly numbers are where you start to see whether things are moving in the right direction.
If Mention Coverage moves from 45% to 48%, 51% and then 53% over four weeks, the picture is clear even with daily ups and downs: your business is appearing in more AI answers.
If it moves from 55% to 52%, 49% and then 46%, each week looks close to the previous one, but the four-week pattern is moving in the wrong direction.
Weekly rule: Compare this week with last week. Direction matters more than the exact number.
Pick one consistent day each week to check.
How to Read Monthly Numbers
Monthly numbers are where you measure real progress.
A full month gives enough time for real changes to start showing in results. If you updated your website in January, February's numbers may begin to show whether the pattern changed.
Monthly rule: Compare this month with last month. This is your real progress check.
Monthly comparisons only become useful after at least two full months of data. In your first month, focus on weekly direction.
What Steady Progress Looks Like
Suppose you run a small HR training company in Kuala Lumpur and start tracking AI visibility in January.
| Month | Mention Coverage | Web Citation Rate | Share of Voice |
|---|---|---|---|
| January | 30% | 12% | 8% |
| February | 38% | 16% | 11% |
| March | 45% | 22% | 15% |
In January, your business appeared in 30 out of every 100 tracked AI answers. By March, it appeared in 45. Your website is being linked more often, and you are gaining a larger share of the conversation compared with competitors.
Steady progress over three months is more meaningful than one great day followed by a slow decline.
What to Do When Your Numbers Drop
The headline number alone does not tell you what to do. Look at the specific questions that make up that number.
Suppose 10 questions are tracked. Last month, your business appeared in 6 answers. This month, it appears in only 4. The two questions where your business stopped appearing are where the explanation is hiding.
Read what AI said and ask:
- Did a competitor start appearing instead?
- Did AI stop recommending any businesses for those questions?
- Did the answer change completely?
That is where the useful information is.
What to Record Before Anything Else
In your first two to four weeks, let the numbers collect. You need a starting point before you can read a trend.
Write down these four numbers at the end of week one:
- Mention Coverage: what percentage?
- Web Citation Rate: what percentage?
- Share of Voice: what percentage?
- Average AI Ranking: what position?
These are your starting numbers. When results improve from here, your efforts may be working. When they drop below here, something needs attention.
What to Do First
- First two to four weeks: Let the numbers collect. Record your starting figures at the end of week one and avoid reacting yet.
- End of your first month: Compare week one with week four. Even a small improvement is a useful early sign.
- End of month two and beyond: Compare month to month. Ask which questions include or miss your business, whether citation rate is rising, whether you are gaining ground against competitors, and whether changes you made coincide with movement.
Checking five AI platforms by hand every week quickly becomes repetitive.
A platform like Zicy tracks the same questions daily and brings the Daily, Weekly and Monthly views together in one place.
You can also mark when you made a meaningful change in the Impact Tracker, then look back at the trend to see what happened afterwards.
Daily, Weekly and Monthly: The Simple Difference
| How to use it | Daily numbers | Weekly numbers | Monthly numbers |
|---|---|---|---|
| What to use them for | Spotting big sudden changes | Seeing if things are moving up or down | Measuring real progress |
| How often to check | Only when something looks very different | Once a week, on the same day | At the start of each new month |
| What to compare | Today versus the past few days | This week versus last week | This month versus last month |
| What to do if numbers drop | Wait a day or two before reacting | Look for a pattern over several weeks | Find which questions changed and why |
| What to ignore | Small up-and-down movements | One bad week in an otherwise improving month | One bad month after steady improvement |
Putting It All Together
Your AI visibility number is not fixed. It moves. Some days go up and others go down. That is normal.
What matters is the same thing that matters for any small business: the pattern over weeks and months, rather than what happened on one Tuesday morning.
The bakery owner who sees double sales on a Tuesday does not call the landlord that afternoon. She waits, looks for the pattern and asks whether it happened again.
Read your AI visibility numbers the same way.
When a number changes, do not stop at the score. Go to the specific question behind it and read what the AI actually said.
See the direction behind
your daily AI visibility data.
Zicy turns daily results into weekly and monthly trends, helping you spot lasting changes and investigate the questions behind them.
