How to present AEO and GEO performance in C-suite marketing reports
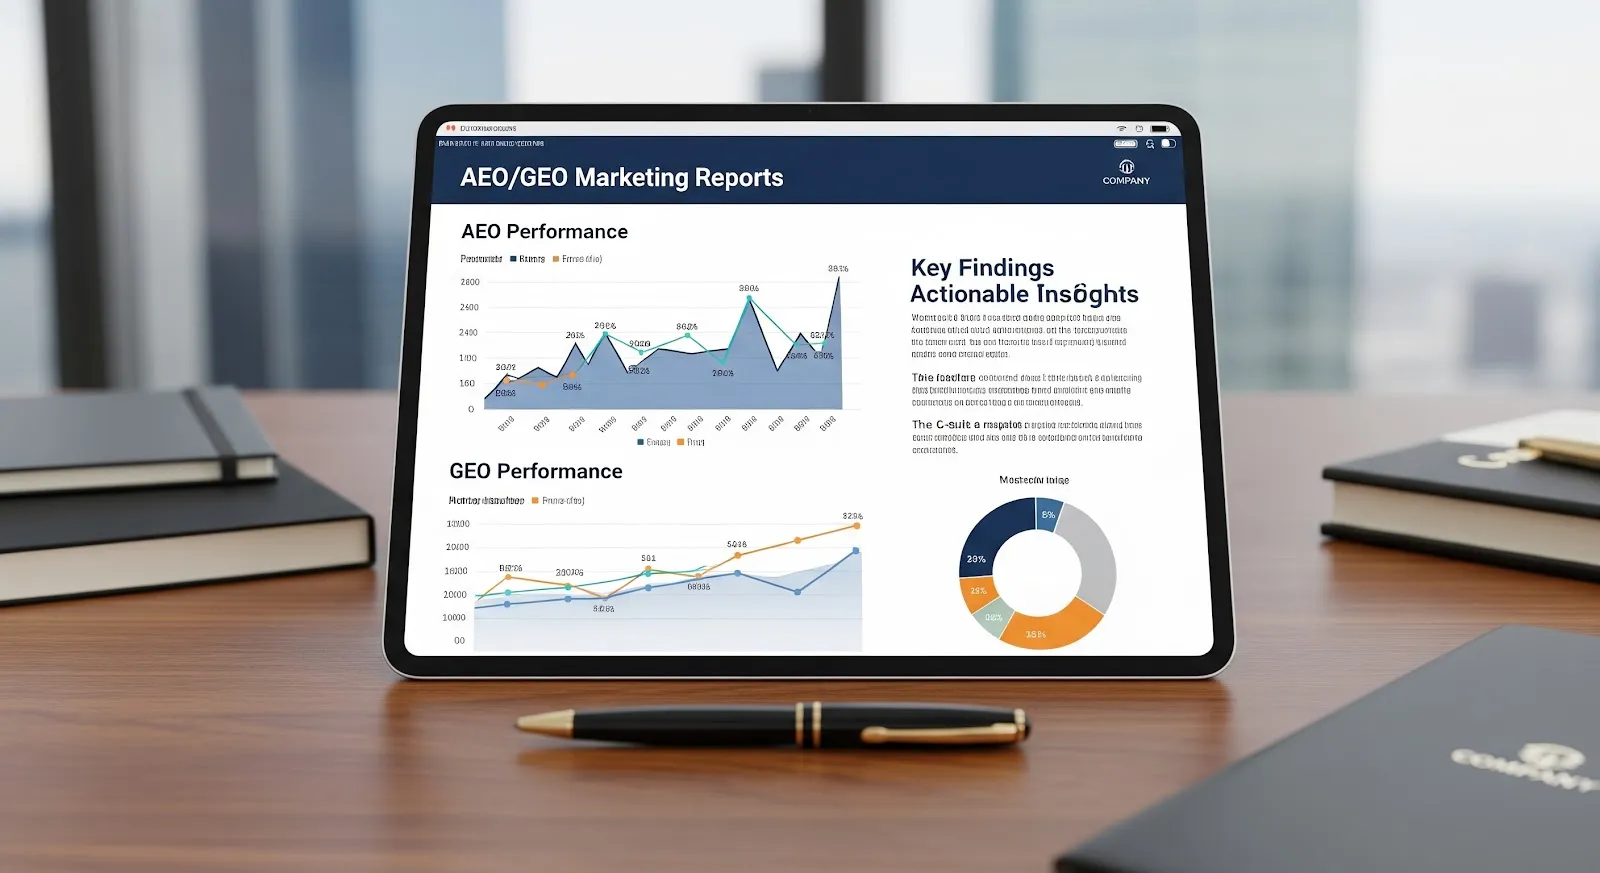
Presenting AEO and GEO performance to the C-suite means translating AI visibility into influence and revenue: how often AI engines cite your brand, your share of voice against competitors, entity accuracy, and how that supports leads. Zicy produces those metrics across ChatGPT, Gemini, Perplexity, Google AI Overviews and Google AI Mode, so reports show business impact, not activity.
Marketing leaders have entered a new era of reporting. Traditional SEO dashboards focused on rankings, impressions and clicks. In the AI visibility era, executives want to know something different: how often is our brand mentioned by AI engines, and how does that translate into influence and revenue? That is the story answer engine optimisation and generative engine optimisation reporting needs to tell, connecting visibility, credibility and commercial impact. At the executive level this is a move from activity-based reporting to influence-based reporting, focused not on what users did but on how your brand shapes decisions before they act.
Why the C-suite needs a new reporting framework.
Boards and executive committees do not speak in click-through rates and bounce rates. They speak in ROI, brand equity and competitive advantage, so AEO reporting must focus on strategic translation rather than technical detail. The C-suite needs to see:
- Brand presence: how often AI systems mention or cite your organisation.
- Brand authority: whether your content is recognised as credible by AI platforms.
- Business impact: how that visibility supports lead generation, partnerships or reputation growth.
This reframes marketing from traffic generation to brand representation. Executives are increasingly interested in whether the brand is shaping category narratives, not just participating in them, and AEO reporting aligns with brand equity measurement, since repeated citations reinforce perception, trust and top-of-mind awareness. It pairs naturally with becoming an authoritative entity for AI engines.
Executives do not buy activity metrics. They buy influence and revenue, and AI is now a real channel.
- AI referral traffic grew more than ten times in the US between July 2024 and February 2025 (Adobe Analytics, US retail, travel and banking traffic, 2025).
- 45% of B2B buyers now use generative AI in the buying process, consulting about seven sources each (Gartner, 645 B2B buyers, 2025).
- Enterprises put about 12% of digital budgets into AEO in 2025, and 94% plan to increase that in 2026 (Conductor, 250+ CMOs, 2026).
The board's question is no longer whether AI matters, but what your visibility in it is worth.
What metrics your AEO and GEO report should include.
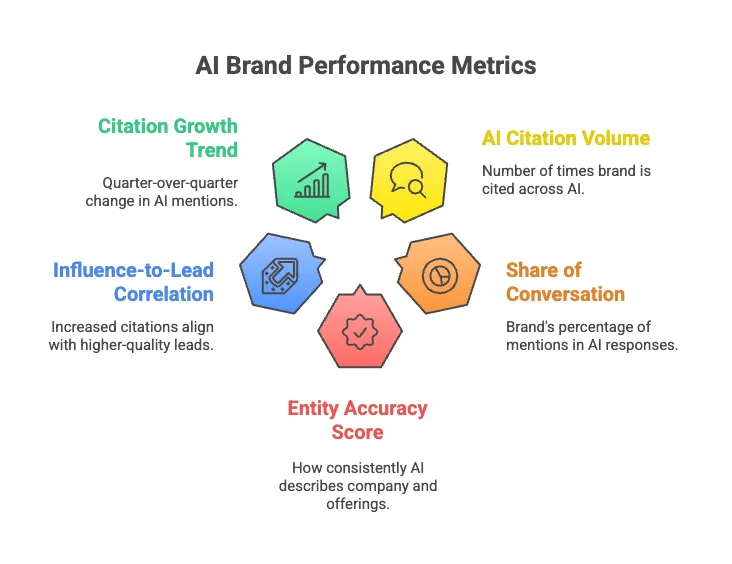
To resonate with executives, your dashboard should show influence over activity. Key metrics:
- AI citation volume: how many times your brand or domain is cited across the engines. See how to track AI citations and their impact.
- Share of conversation, or share of voice: your brand's percentage of mentions in AI responses within your category.
- Entity accuracy: how consistently AI engines describe your company and offerings. See the KPIs that replace traditional SEO metrics.
- Influence-to-lead correlation: whether increased citations align with higher-quality leads or shorter sales cycles.
- Citation growth trend: quarter-over-quarter change in AI mentions, to show compounding visibility.
Each metric should connect to a tangible business outcome. Add prompt-level coverage to show which high-intent queries your brand appears in, and average AI positioning to show whether your brand is mentioned early or late within answers. Together these form a more complete view of your competitive standing in generative ecosystems.
Report influence, and be honest about attribution.
- 68% of US Google searches now end without a click to the open web (SparkToro with Similarweb, 2026), so much AI influence never shows up as a session.
- AI search is still under 1% of referral traffic while Google holds most of it (BrightEdge, 2025), so present AI visibility as a growing top-of-funnel signal, not a direct-conversion channel yet.
The four board-ready numbers are mention coverage, citation rate, share of voice and average AI ranking, tied to AI-referred pipeline.
How to tell the AEO and GEO story effectively.
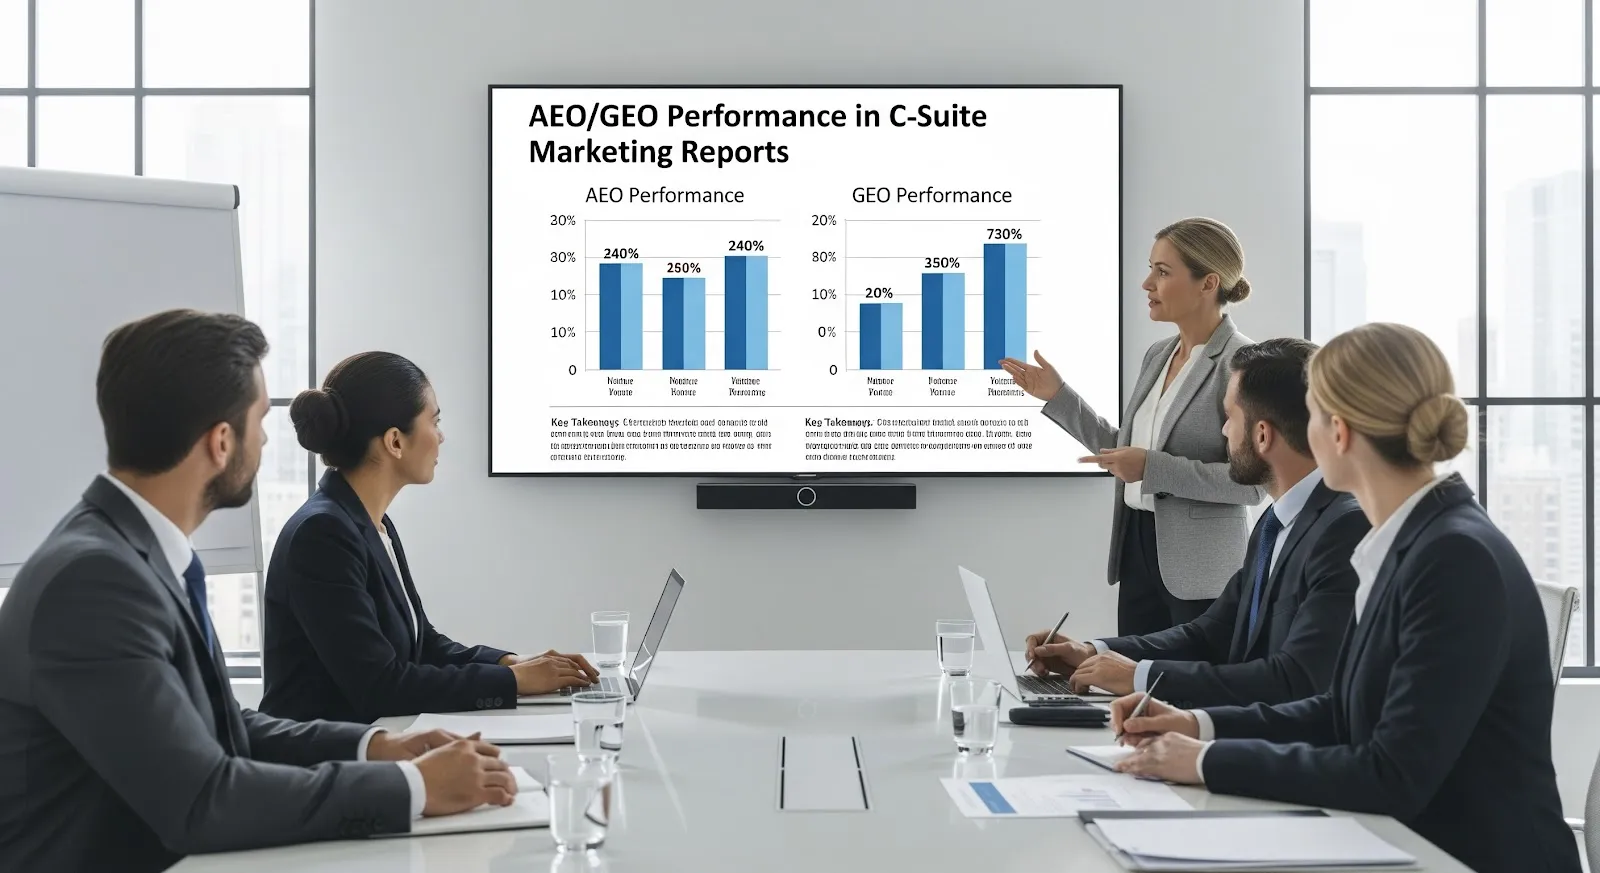
Data alone will not move leadership; context will. Frame the report around a narrative arc executives can follow:
- Shift in discovery: search is now answer-first, so visibility depends on being cited by AI engines, not just ranked by Google. See how AI Overviews and ChatGPT change SEO.
- Current standing: how many times per month you are mentioned in generative engines, and in what share of relevant prompts.
- Competitive position: where a competitor has higher citation share but your entity accuracy is stronger, or the reverse. See how to benchmark AEO readiness against competitors.
- Growth plan: expanding structured data, improving authorship signals and strengthening PR validation. See how PR and Wikidata improve AI visibility.
Anchor the narrative in business outcomes such as improved lead quality, shorter sales cycles or increased brand recall, and include before-and-after snapshots of citation growth and entity accuracy to demonstrate progress. This structure turns complex metrics into strategic insight and reinforces marketing's role as a growth driver.
When AI does send a visit, it converts. The gap between AI-referred and other visitors narrowed from 43% less likely to convert to just 9% in seven months, and those visitors browsed 12% more pages and stayed 41% longer (Adobe Analytics, 2025).
Refresh the numbers continuously, not once. Only 32% to 43% of AI-cited sources repeat within 24 hours (Schulte, Bleeker and Kaufmann, arXiv, 2026), so show trend lines and explain that month-to-month movement is normal. And since 15 May 2026 Google treats manufactured mentions as spam (Search Engine Land, 2026), so the story to leadership is one of earned, measured authority, the basis of Growth.pro's PAVA framework.
How to visualise AI performance in reports.
Executives absorb information best through simple, visual storytelling:
- Use line graphs to show citation growth over time.
- Compare AI visibility share with search traffic trends to highlight the paradigm shift.
- Add screenshots of AI answers citing your brand to make the data concrete.
- Include a single composite summary score that combines citations, accuracy and trust.
- Add competitive comparison charts and a prompt-coverage heatmap showing where you are strong or missing across query types and funnel stages.
The best C-suite reports do not overwhelm, they persuade. The goal of AEO reporting is not just to inform but to influence strategic direction, positioning marketing as a driver of long-term advantage in AI-led discovery. Your report should tell a simple story: the brand is not just being found, it is being trusted by the systems shaping tomorrow's decisions.
Questions about presenting AEO and GEO performance.
Which AEO and GEO metrics belong in a board deck, and which are vanity?
Lead with four: mention coverage, citation rate, share of voice and average AI ranking, tied to AI-referred pipeline. These map to influence and revenue. Raw impressions and follower counts are vanity in this context; leave them out.
How do I connect AI visibility to pipeline when so much is zero-click?
Combine reads rather than chasing last-click. About 68% of US Google searches now end without a click (SparkToro with Similarweb, 2026), so pair AI referral sessions with branded-search and direct lift after citation gains, and assisted or influence attribution against your CRM.
How do I benchmark our AI visibility against named competitors for the C-suite?
Report share of voice against a fixed competitor set, per engine and over time. A rising share and shrinking prompt gaps tell a clearer story to executives than any absolute number.
How often should these numbers refresh, and how do I explain volatility?
Continuously, and show trends, not snapshots. Only 32% to 43% of AI-cited sources repeat within 24 hours (Schulte, Bleeker and Kaufmann, arXiv, 2026), so frame month-to-month movement as normal and focus leadership on the direction of travel.
Turn AI visibility into a board-ready story.
Zicy reports citations, share of voice and entity accuracy across ChatGPT, Gemini, Perplexity, Google AI Overviews and Google AI Mode.
